One of the main reasons I went with Lowrance was familiarity. I have owned numerous Lowrance GPS units starting in 1998 with a handheld Eagle. They have always been very dependable and fairly easy to use. Plus, over the last 15 years of long distance river cruising I have developed a considerable database of Lowrance waypoints, trails, icons and routes. I really hated to lose these if I went elsewhere. In addition, in my opinion when I started cruising Lowrance had the best charting for inland rivers including Points of Interest. I did give Garmin some thought because of their huge popularly but the factors above – right or wrong - pushed me to Lowrance.
My Opinion
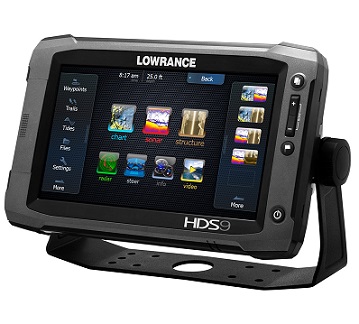
I will say for the most part I am pleased with the plotter. The touch screen itself if worth considerable treasure. On the older button type units entering text was very cumbersome. This was not a Lowrance problem but rather just the way things were. You used a four-direction button to rotate through the alphabet and symbols and one at a time select the letters. Painfully slow! The touch screen provides a keyboard and you just type in what you want – changes a two-minute job into five seconds. Just just touching the screen can mark waypoints and making a route is just a series of taps. You also can drag the screen to move the chart around. Although you can’t “pinch” the screen and zoom in it is still a huge leap forward. I will say the entire system seems a somewhat sluggish at times – as if there is not enough CPU power to keep up. This was even more pronounced when sonar logging (see below).
 Another
note is the Lowrance interface I was so familiar with is now gone. This
meant there was a sizable learning curve and I still struggle a bit
with some of the less used features. But this change was obviously to
make smoother use of the touch screen function. I have no qualms with
the interface just not what I was use to.
Another
note is the Lowrance interface I was so familiar with is now gone. This
meant there was a sizable learning curve and I still struggle a bit
with some of the less used features. But this change was obviously to
make smoother use of the touch screen function. I have no qualms with
the interface just not what I was use to. As to my self-created large library of routes and waypoints - forget it! They will import and can be used but are for all practical purposes not editable. I messed all summer trying to make them work and only succeeded in frustrating myself. Finally, I decided it was a hopeless and resigned myself to the reality I will have to start over and build them all new. This was a major reason I stayed with Lowrance and now it is gone.
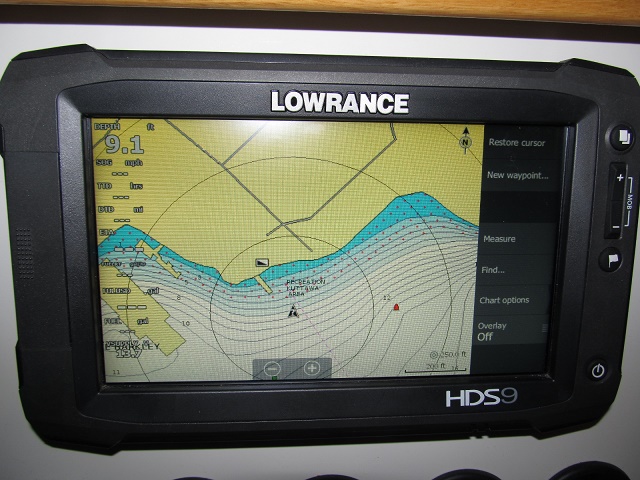
I will say the unit's built-in map is decent but that is about it. I honestly hoped for a little more accuracy of the depth contours for the inland lakes and rivers. Understand it is not bad, I just had higher expectations. To counter this Lowrance has a custom mapping feature that allows you to record your sonar signals on a memory card. Once home these are uploaded to Lowrance and they compile them. In a few days they return the data as a map update that can be loaded back on to the plotter. This allows you to make a very accurate map of the waters you regularly ply. OK, that will overcome the less than expected built-in chart. Well, not really.......
 Lowrance
calls the process of self logging "Community Mapping." The map I create
is uploaded, processed and returned to me for use BUT if I allow it is
combined with other users maps to create a more complete view of the
body of water. In theory this is a great idea and should make
maps more accurate but unfortunately that is not what I am
seeing. My best guess is the contour lines created in the process
are accurate but for what ever reason the depth readings defining the
contours are not. I was seeing areas of 50' depths off by 20'. In
shallower water even depths collected by my unit and returned are often
off by 3 or 4 feet. Maybe this is workable for fishing but for my
navigational use it is not - to me a wrong reading is worse than no
reading as it can offer false information with serious results.
As a result, I have ceased recording the
logs.
Lowrance
calls the process of self logging "Community Mapping." The map I create
is uploaded, processed and returned to me for use BUT if I allow it is
combined with other users maps to create a more complete view of the
body of water. In theory this is a great idea and should make
maps more accurate but unfortunately that is not what I am
seeing. My best guess is the contour lines created in the process
are accurate but for what ever reason the depth readings defining the
contours are not. I was seeing areas of 50' depths off by 20'. In
shallower water even depths collected by my unit and returned are often
off by 3 or 4 feet. Maybe this is workable for fishing but for my
navigational use it is not - to me a wrong reading is worse than no
reading as it can offer false information with serious results.
As a result, I have ceased recording the
logs. I did ended up buying the Navionics+ chart memory card that covers the entire US. It seems to provide more accurate information and the chart display is user configurable to better suit your taste. A nice feature is I can toggle between the two charts and look at the differences. In fact, if properly loaded I can toggle between the Lowrance, Navionics and the Community Maps with a couple touches of the screen. Still, I normally run the Navionics mapping as I like the better detail and accuracy.
Interestingly, Navionics has a similar sonar logging feature where you record and transmit you data to them BUT Lowrance has again said OUR WAY or NO WAY and blocked this feature from working with the Navionics card. I find it strange Lowrance is willing to sell the Navionics card but with their hardware cripples part of its features. And this is intentional. Older versions of the plotters operating system would allow the logging to Navionics but the more recent updated stopped it. Thanks Lowrance!
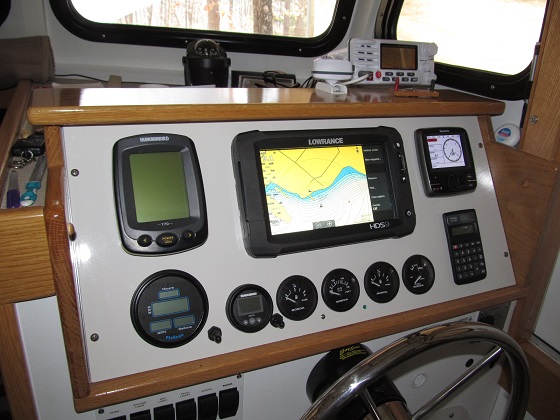
On the upside having the chartplotter on the NMEA 2000 network does open up a lot of possibilities. For example, my Honda BFP60 outboard also is networkable which allows monitoring of the engine form the screen. Different engines provide different data but most cover all the critical information.
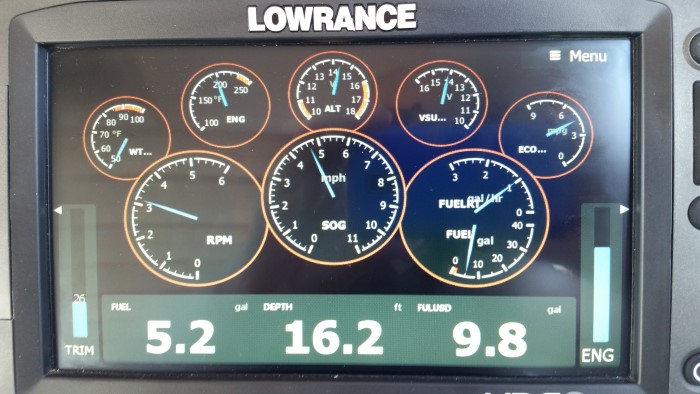 On
the HDS Gen2 I have the option of three different totally customizable
screens they call a "Dash." I have each set up to provide
different types of data. Here is a shot of my #1 Dash showing the
actual engine outputs. At the time this was taken I was pushing
upstream against a good 1.5 to 2 mph current. As you can see I am
running at my average cruise RPM of 3100 but my "speed over ground"
(SOG) is only about 4.6 mph. Plus my fuel burn (Fuel RT) is pegged
at about 1 gallon per hour yielding about a fuel economy (ECO) of about
4.6 mpg.
On
the HDS Gen2 I have the option of three different totally customizable
screens they call a "Dash." I have each set up to provide
different types of data. Here is a shot of my #1 Dash showing the
actual engine outputs. At the time this was taken I was pushing
upstream against a good 1.5 to 2 mph current. As you can see I am
running at my average cruise RPM of 3100 but my "speed over ground"
(SOG) is only about 4.6 mph. Plus my fuel burn (Fuel RT) is pegged
at about 1 gallon per hour yielding about a fuel economy (ECO) of about
4.6 mpg.Also showing is the line voltage (VSU), the actual alternator output (ALT), the engine water temp (ENG) and the river's water temperature (WT). The temperature was actually about 40 degrees but I don't have the range set that low. Along the bottom is the fuel remaining (FUEL), the water depth (DEPTH) at my current location and the fuel used (FULUSD) since my last fill. Most all of these reading allow alarms to be set to sound if the numbers fall out of a desired range.
On every screen of the plotter no matter what I am looking at the most important number the entire system yields is alway there in bold numbers - the DEPTH reading. By choice I have it placed everywhere as I feel it is critical information.
It is interesting there are N2K sensors available for almost every functioning system on the boat. And everything can be monitored though on the screen with no analog instruments needed on the panel. The NMEA 2000 network is an amazing asset if only all the manufactures would get 100% on board.